Dashboard Overview
Your Zenovay dashboard provides real-time insights into visitor behavior, trends, and conversions.
Dashboard Sections
Real-Time View
Monitor current visitor activity as it happens:
- Active Visitors - Users currently on your site
- Live Page Views - Pages being viewed right now
- Active Sessions - Ongoing user sessions
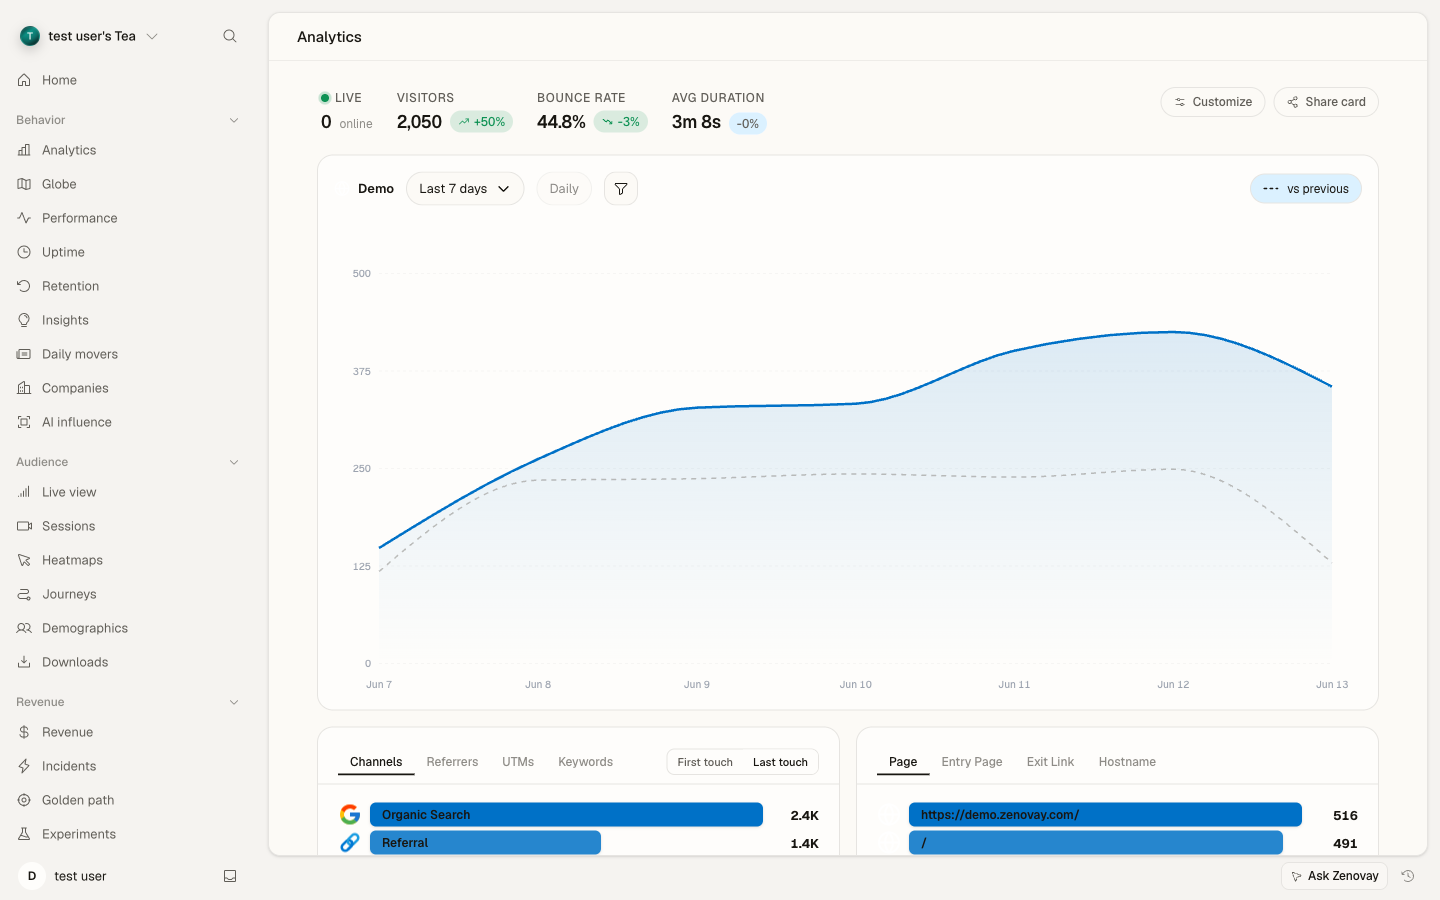
Analytics Overview
View key metrics at a glance:
| Metric | Description |
|---|---|
| Total Visitors | Unique visitors in selected period |
| Page Views | Total pages viewed |
| Bounce Rate | % of single-page sessions |
| Avg. Session Duration | Average time spent per session |
Top Pages
See which pages get the most traffic:
- Page URL
- Total views
- Unique visitors
- Average time on page
- Bounce rate per page
Traffic Sources
Understand where your visitors come from:
- Direct - Direct traffic
- Organic Search - Google, Bing, etc.
- Referral - Other websites
- Social - Social media platforms
- Email - Email campaigns
- Paid - Paid advertising
Key Features
Filters
Filter data by:
- Date range (today, week, month, custom)
- Traffic source
- Device type (desktop, mobile, tablet)
- Location (country, city)
- Browser / OS
Up to 10 filters can be applied simultaneously. Filters sync with the URL so you can share filtered views.
Goals and Conversions
Track important business metrics by setting up custom goals:
// Track a conversion goal
zenovay('track', 'goal_completed', {
goal_name: 'trial_signup',
goal_value: 29.99
});
Goals can be created manually in the dashboard or auto-discovered when your tracking code sends goal events.
Funnels
Analyze conversion funnels:
- Define funnel steps
- See drop-off at each stage
- Identify optimization opportunities
- Calculate conversion rates
Journeys
Visualize how users navigate your site with session journey maps:
- Entry pages
- Path through your site
- Exit pages
- Drop-off points
3D Globe
The 3D Globe provides a real-time geographic visualization of your visitors:
- Live visitor markers with DiceBear avatars
- Activity feed showing recent visitors
- Ambient music player
- Fullscreen mode for presentations
- Public sharing via link
See the Real-time Tracking documentation for details.
Visitor Value Scoring
Zenovay calculates a value score (0-100) for each visitor based on behavior signals:
- Pages viewed and time on site
- Return visit frequency
- Goal completions
- Engagement signals
The value score is displayed on the 3D Globe (marker size scales with value) and in visitor detail views.
Data Export
Export your data in multiple formats:
- CSV - For Excel and spreadsheets
- JSON - For custom integrations
API Access
Access your data programmatically:
curl -X GET 'https://api.zenovay.com/api/external/v1/analytics/{websiteId}' \
-H 'X-API-Key: zv_YOUR_API_KEY'
Dashboard Navigation
Sidebar Navigation
The sidebar provides access to all dashboard areas:
Global Navigation:
- Home - Main dashboard overview
- Domains - Your tracked websites
- Agency - Multi-site management (Scale and above)
- AI Insights - AI-powered analysis (Pro and above)
- Interviews - User interview tools (Pro and above)
- Settings - Account and workspace configuration
- Support / Help Center
Domain Navigation (when viewing a specific domain):
| Group | Tabs |
|---|---|
| Behavior | Analytics, Globe, Performance, Uptime, Retention, Insights, Daily movers, Companies, AI influence |
| Audience | Live view, Sessions, Heatmaps, Journeys, Demographics, Downloads |
| Revenue | Revenue, Incidents, Golden path, Experiments |
| Reliability | Errors, Trust, Carbon, Consent |
| Configure | Widgets, Query Studio |
API key management is under Settings → Security → API keys, not the top-level sidebar.
Command Palette
Press Cmd+K (Mac) or Ctrl+K (Windows/Linux) to open the command palette for quick navigation and search across your dashboard.
Customization
Personalize your dashboard:
- Dark/light mode toggle
- Collapsible sidebar
- Team-based access and organization switching
Next Steps
Open Domains, select a site, and use the tab group to explore each analytics view.
Learn more:
- Custom Events - Track what matters
- API Reference - Programmatic access